Rashi Peripherals (RPTECH): the 13-Week Base That Ran +91%
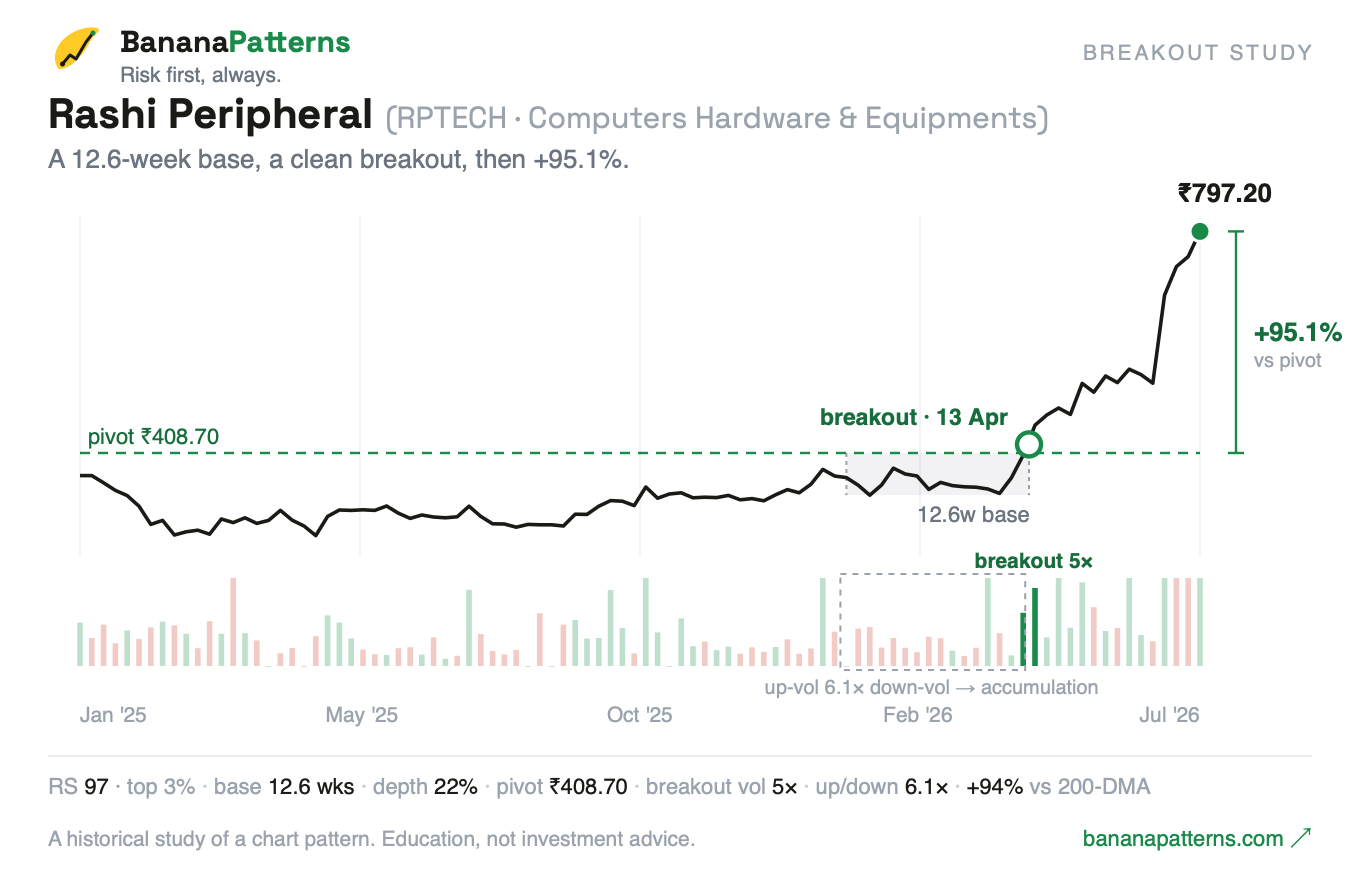
Before it moved, Rashi Peripherals looked like nothing was happening. Price drifting sideways for three months, volume fading, the chart boring enough that most people scrolled past. Then on 13 April 2026 it cleared ₹408.70 on a surge of volume — and ran +91% in 73 days.
This is a plain-English walk-through of that setup: the base, the volume tell, the pivot, and what happened next. It's a worked example on past data — education, not advice.
Education, not advice. This is a historical study of a chart pattern. Patterns fail often; nothing here is a recommendation to buy or sell anything.
What the setup looked like
For about 13 weeks, Rashi Peripherals built a base roughly 22% deep. The key wasn't the depth — it was the shape. Each pullback inside the base was shallower than the one before: the volatility contraction that signals sellers drying up and the stock coiling. That tightening is the "VC" in VCP.
The volume tell
Through the base, up-day volume ran about 7.7× the down-day volume. Price was quiet, but the volume was shouting accumulation — buyers stepping in on the up days while sellers thinned out on the down days. This is the quiet hand-over that happens underneath a flat-looking chart.
The breakout
The trigger was the pivot at ₹408.70 — the ceiling at the top of the base. On 13 April 2026, price cleared it on roughly 5× normal volume. The volume on the breakout is everything: it's what separates a real move from a fake-out. No base, no trade; no volume, no breakout.
What happened next
Since the breakout, the move is +91% in 73 days, with the stock sitting around 96% above its 200-day line — textbook Stage 2 leadership. It also carried a Relative Strength rating of 97 going in, i.e. outrunning 97% of the market (see RS, explained).
To be clear: we didn't predict this. We flagged the pattern — a leader, basing quietly, on rising accumulation — and then let it prove itself.
The point
We don't pick winners. We track one repeatable pattern — the volatility contraction base — and study the names that complete it. Some work, many don't; the edge is in the process, not any single name. Rashi Peripherals is one clean example of the shape doing what the shape sometimes does.
Frequently asked questions
What pattern did Rashi Peripherals (RPTECH) form before its run?
A Volatility Contraction Pattern (VCP) — a ~13-week base where each pullback got shallower and volume dried up, before a high-volume breakout above the ₹408.70 pivot on 13 April 2026.
How much did RPTECH move after the breakout?
About +91% in the 73 days following the 13 April 2026 breakout, in this historical study. Past moves are not predictions; most bases do not run like this.
Was this a buy recommendation?
No. BananaPatterns is educational. This is a worked example of a chart pattern on past data, not a recommendation to buy or sell RPTECH or anything else.
How do you spot a setup like this before it breaks out?
Look for a strong (high relative-strength) stock, pausing in a base where pullbacks tighten and volume fades, coiling under a clear pivot. BananaPatterns scans every Indian stock each evening for exactly this shape.
The takeaway
The biggest moves rarely start with a bang — they start in the quiet, with a leader tightening and volume fading beneath a flat price. Rashi Peripherals built that base in plain sight; the breakout just released what the base had been building.
Risk first, always.
BananaPatterns is an educational resource. We are not SEBI-registered advisers, and nothing here is investment advice. Historical figures are backtests/historical studies, not a live record. Trade your own decisions.